
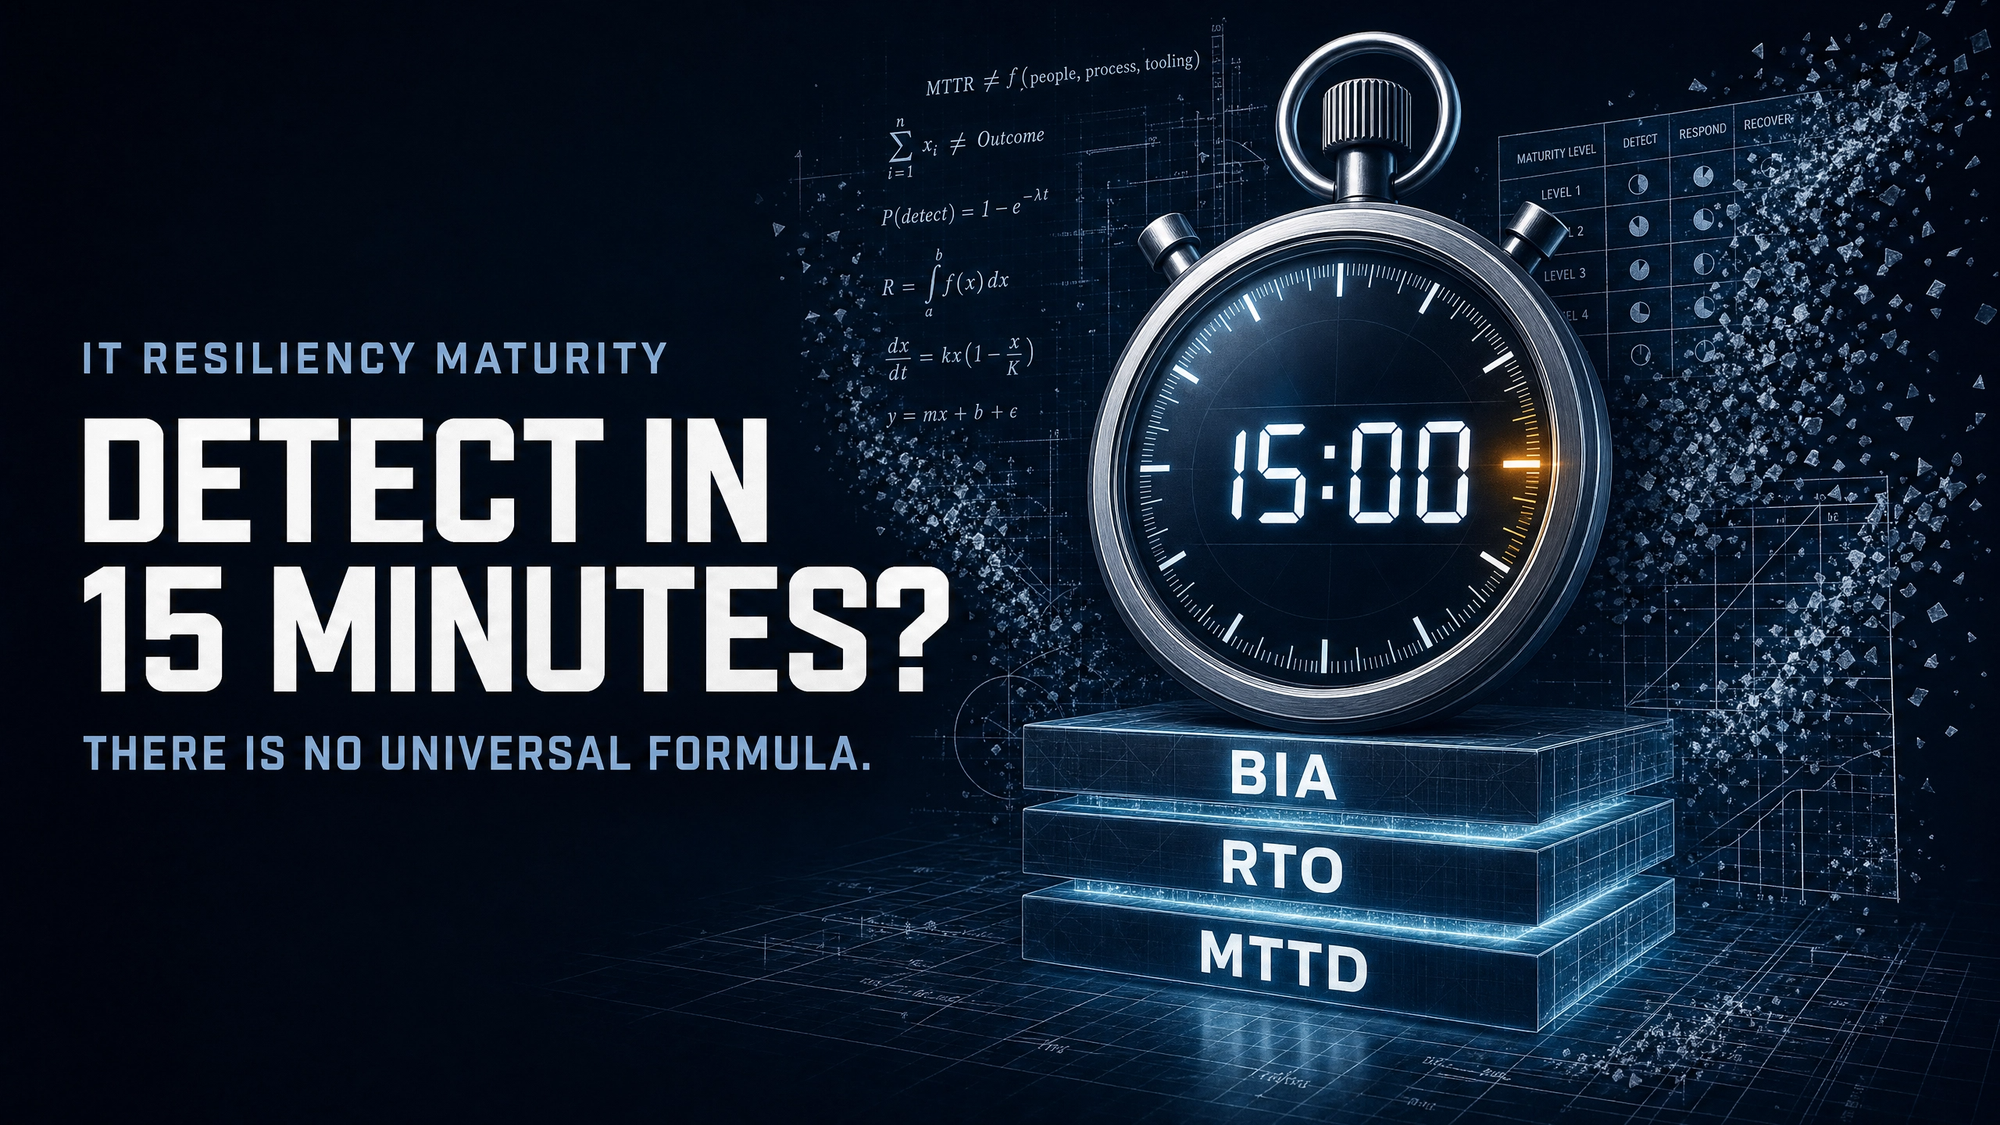
This is the long-form version of a piece I published on LinkedIn. Over there I made the argument; here I show the working — the arithmetic, the decomposition, and the method. If you only want the argument, the LinkedIn version will do. If you intend to defend a number in front of an auditor, a regulator, or your own CFO, read on.
A maturity model told us that at Level 3, an organization should detect incidents within 15 minutes to an hour. Someone on my team asked the obvious question: says who?
Nobody in the room had an answer. Neither, it turned out, did the fourteen frameworks the model was synthesized from. This post is the answer we ended up building ourselves.
What we set out to do
My team has been running a study on IT resiliency maturity, together with colleagues who own service quality. The intent is pragmatic: before we tell anyone what "more resilient" means, we should be able to say where we stand today, in numbers, against something more solid than opinion.
Step one sounded trivial: find the framework — the one that defines resiliency maturity levels and prescribes what MTTD, MTTR, RTO and RPO should look like at each level. Quantify against it. Done.
Step one failed. Not because we searched badly, but because the thing does not exist.
The empty shelf: what the standards actually say
We went through the shelf properly, and the pattern is remarkably consistent — every standard defines the obligation to have numbers and stays silent on the values:
ISO 22301:2019 requires you to establish "prioritized timeframes for resuming activities" (Clause 8.2, the BIA clause). It never suggests what those timeframes should be. The standard is a management-system standard: it audits whether your process for setting numbers is sound, not whether your numbers match a table.
NIST SP 800-34 Rev. 1 says MTD, RTO and RPO "shall be formally documented for each system" — documented by you, derived from your own business impact analysis (Sections 2.2.1–2.2.2). Its only quantitative guidance is directional: your RTO drives your recovery-site strategy — cold, warm, hot, or mirrored (Section 2.4). The number flows from your BIA into your architecture, never the reverse.
CMMI describes process capability: ad-hoc, managed, defined, quantitatively managed, optimizing. Its Level 4 says you should have quantitative objectives and manage against them statistically. It does not contain a single operational quantity. That is by design — CMMI is domain-agnostic.
ITIL 4 hands you the machinery — the incident priority matrix (impact × urgency), resolution SLAs per priority tier, availability management — and politely leaves every cell blank.
Uptime Institute Tiers quantify infrastructure topology (concurrent maintainability, fault tolerance), which implies availability classes for the facility layer. Nothing about detection, and nothing about how fast your organization recovers.
FFIEC and DRII give you BIA methodology — including the crucial idea that impact escalates nonlinearly over time — but again: methodology, not values.
The silence is not an oversight and not a gap for some future revision to fill. The standards are silent because the honest answer is it depends on your business impact, and no committee in Geneva, Gaithersburg or Axelos knows your business impact.
A confession that belongs here: we used AI heavily to synthesize those fourteen frameworks into one maturity model, and it produced something genuinely useful — five levels, nine dimensions, metric bands for each, with clause-level traceability back to the sources. But when we pushed on any single number — where does "15 minutes to 1 hour" actually come from? — the synthesis had no answer either. It had compressed the industry's collective habits into a table. It could not tell us why the habits were what they were. That question needed the room, not the tool.
So what are those numbers, really?
Here is the epistemic status of every metric band in every resiliency maturity model I have now seen, including our own: they are empirical benchmark clusters — descriptions of what organizations at a given capability level typically achieve. The same status as the DORA elite/high/medium/low clusters in Accelerate: derived from observing distributions, not from first principles. Descriptive, not prescriptive.
That sounds like a weakness. It is only a weakness if you adopt the bands as targets without local derivation. Because when we pulled on the thread, the bands turned out to be held together by three anchors — and understanding the anchors is what turns a borrowed table into a defensible position.
Anchor 1 — Availability arithmetic: the only real math in the model
The "nines" table is not a benchmark; it is arithmetic:
| Availability | Downtime budget per year |
|---|---|
| 99% | 87.6 hours |
| 99.9% | 8.76 hours |
| 99.99% | 52.6 minutes |
| 99.999% | 5.26 minutes |
Annual downtime ≈ incident frequency × mean outage duration. And outage duration decomposes into a chain:
outage duration = detect + acknowledge/triage + diagnose + recover + verify
                  └────── what we report as "MTTR" covers most of this ──────┘
This forces internal consistency across each maturity level's row of metrics. Take Level 3 in our model: availability 99–99.9%, i.e., a downtime budget of 8.76–87.6 hours per year. An organization with, say, 10–25 significant incidents a year at an MTTR of 2–8 hours lands at roughly 20–200 hours of annual downtime — straddling exactly that band. Now try to break it: claim Level 3 availability of 99.99% alongside an MTTR of 2–8 hours. One bad incident consumes the entire annual budget. Incoherent.
This is the first honest thing to say about maturity-model metrics: their validity is horizontal, not vertical. They do not descend from a standard above; they cohere with each other across the row. A model whose rows survive the calculator is worth using. A model whose rows don't is decoration.
Anchor 2 — Detection physics: MTTD encodes the mechanism, not an ambition
MTTD is not a free variable you set by aspiration. It is a function of how incidents get detected at each maturity level, and each mechanism has a physical floor:
| Level | Dominant detection mechanism | Physical floor |
|---|---|---|
| L1 | Users call the helpdesk | Hours — depends on user tolerance and ticket routing |
| L2 | Basic infra monitoring, manually watched | 1–4 h — someone has to be looking at the dashboard |
| L3 | Centralized monitoring + alert routing + on-call | 15 min – 1 h |
| L4 | APM, synthetics, event correlation, SOAR | < 15 min — machine-speed correlation, human confirms |
| L5 | AIOps / streaming anomaly detection | < 5 min — detection ahead of threshold breach |
Now the specific question that started all this: why 15 minutes to 1 hour at Level 3? Decompose how human-in-the-loop centralized monitoring actually works:
polling / scrape interval:            1 – 5 min
sustained-breach alert threshold:     5 – 15 min   (required, or you drown in flapping alerts)
page → human acknowledgment:          5 – 15 min   (a realistic on-call SLA)
triage to "confirmed incident":       5 – 25 min
                                     ─────────────
                                      ~16 – 60 min
The band is not a target somebody chose. It is what a well-run human-in-the-loop monitoring operation can physically deliver. To detect faster than ~15 minutes, you must remove the human from the detection loop — automated correlation, automated confirmation — which is precisely what the Level 4 capability descriptions in the same model say (SOAR, orchestrated response). The metric bands and the maturity descriptions turned out to be two views of the same fact. Nobody wrote that down in any of the fourteen sources. It falls out of the decomposition.
Anchor 3 — The RTO chain: detection spends the recovery budget
The RTO clock starts at the point of disruption, not at the point of detection. Therefore:
RTO ≥ MTTD + decision/activation + recovery execution + validationEvery minute of undetected outage is spent from the RTO budget before recovery even begins. This yields a working consistency rule:
MTTD should be a small fraction of RTO — roughly 5–10% for tier-1 services.
Check the model against it: L3 RTO is 4–24 hours; MTTD of 15 min – 1 h is about 4–6% of the lower RTO bound. Holds. A hypothetical model claiming L3 RTO of 4 hours with MTTD of 2 hours would burn half the recovery budget before anyone acts. Fails.
The same coupling exists with RPO, and it is nastier because it is invisible: you cannot honor an RPO of 1–8 hours if data-affecting failures go undetected for 4+ hours. Corruption replicates. Backup cycles roll over. Your stated RPO stays on the slide; your effective RPO silently becomes MTTD-bounded. Detection time is a binding constraint on data loss, not just on downtime.
The risk derivation: what does a 15-minute detection actually avoid?
MTTD traces to one specific risk mechanism: impact accumulation during undetected failure. Detection is the multiplier on every other risk, because nothing in the response chain can start before it. Four concrete impact classes:
Linear burn. Impact = cost-rate × total duration, and MTTD is the least defensible segment of that duration — nothing is even being attempted yet. Worked example: a revenue-affecting service losing $50k per hour, 12 significant incidents a year, detection improved from 4 hours (typical L2) to 30 minutes (mid-L3):
12 incidents × 3.5 h recovered × $50k/h ≈ $2.1M per year— of avoided undetected burn, before you improve recovery itself by a single minute. This is also the shape of the business case for detection investment: avoided loss = incident rate × cost rate × (MTTD_baseline − MTTD_target).
Nonlinear thresholds. BIA methodology (FFIEC, DRII) models impact as escalating with duration, not linear: SLA credit thresholds, peak-hour crossover, batch-window collisions, social-media visibility. An outage detected in 20 minutes is often externally invisible. The same outage detected at hour three is a public event. The L3 band sits deliberately below the typical "your customers become your monitoring system" threshold.
Regulatory clocks. Financial-sector regulators impose notification windows measured in hours or less — Singapore's MAS TRM Notice requires notifying the regulator within one hour of discovering a relevant incident. You cannot operate inside a one-hour notification regime with four-hour detection; the maths does not close. For regulated and quasi-regulated sectors — banking, or telco quality-of-service obligations — L3-grade detection is not an aspiration, it is the minimum at which compliance is mechanically possible.
RPO protection. As above: MTTD shorter than your backup and replication cycle time is the condition under which your stated RPO is real rather than theoretical.
Building the formula you can actually defend
Since no standard hands down the numbers, the defensible chain has to be local. Here is the method we converged on — six steps, each traceable:
- BIA → MTD. For each business function, establish the maximum tolerable downtime — the duration at which impact becomes intolerable — with the impact-over-time curve made explicit, not assumed linear (ISO 22301 8.2; NIST 800-34 2.2.2).
- MTD → RTO. Set RTO below MTD with a safety buffer, per criticality tier, signed off by the business owner. Not by IT. The business owns the tolerance; IT owns the delivery.
- RTO → phase budgets. This is the move borrowed from SRE error-budget thinking: allocate the RTO across detect / decide / recover / verify. Set MTTD_target = α × RTO, with α = 5–10% for tier-1 as the opening position.
- Calibrate α from your own history. Measure the P50 and P90 detection share across your last 12–24 months of incidents. If detection currently consumes 40% of outage duration, that — not a borrowed band — is your improvement case, and it will be far more persuasive in a budget conversation.
- Validate economically. Run the avoided-loss calculation above. Confirm the detection investment — tooling, on-call, correlation — costs less than the loss it prevents. If it doesn't, the target is wrong, not the budget.
- Then, and only then, place yourself on the maturity model — using its bands as a cross-industry sanity envelope: "our derived tier-1 MTTD target is 20 minutes; organizations with our capability profile typically achieve 15–60; we are internally consistent and externally plausible." That sentence survives any audit. "The model said so" does not.
The measurement trap that will eat your baseline
One hard-won practical warning. MTTD and MTTR numbers are brutally sensitive to clock definitions — far more sensitive than they are to actual capability differences.
Does the detection clock stop at the first monitoring event? The first ticket? The first human confirmation? Does the recovery clock stop at service-restored or at incident-closed? Different answers move the same operation across maturity bands by a factor of two to five. Two teams with identical capability can sit two maturity levels apart purely on definitions — and a team under pressure to show progress will drift, without ever meaning to, toward the definitions that flatter it.
Freeze the clock definitions in writing, jointly with whoever owns service quality, before measuring a single baseline. Otherwise the entire quantification exercise is unanchored, and every improvement you later report is contestable.
Where this leaves the maturity model
Not discarded — repositioned. A maturity model is a poor source of targets and an excellent instrument for two other jobs: assessment (where are we, in a language nine dimensions wide?) and communication (what does better look like, in a form a leadership team can hold in one glance?). The bands are the sanity envelope around targets you derive yourself. Used that way, the model's constructed nature stops being an embarrassment and becomes exactly what you say it is — which, in my experience, makes the work more credible in front of a sceptical audience, not less.
The authority we went looking for externally has to be built internally. I now think that is not a bug in the standards landscape. It is the standards landscape quietly telling you whose job the numbers are.
What I want to argue about
I don't believe we are the only team that went looking for the formula. So, to the operators, SREs, architects and risk people reading this:
When you set your MTTD or MTTR targets — did you derive them from business impact, or adopt them from a vendor deck or a maturity model? Honestly?
If you derived them: what fraction of RTO do you allocate to detection? We landed on 5–10% for tier-1 as a working rule, and I am not fully sure of it yet.
And has anyone found a published framework that genuinely prescribes these values — or is the silence of the standards as universal as it looks from here?
Comments are open here and on the LinkedIn version. Disagreement is the point.
References
- ISO 22301:2019, Security and resilience — Business continuity management systems — Requirements, esp. Clause 8.2 (business impact analysis and prioritized timeframes). International Organization for Standardization.
- NIST SP 800-34 Rev. 1, Contingency Planning Guide for Federal Information Systems, Sections 2.2 and 2.4. National Institute of Standards and Technology, 2010.
- CMMI Institute, CMMI for Services v2.0, Maturity Levels 1–5, 2018.
- AXELOS, ITIL 4 Foundation, incident management and availability management practices, 2019.
- B. Beyer, C. Jones, J. Petoff, N. R. Murphy (eds.), Site Reliability Engineering: How Google Runs Production Systems, O'Reilly Media, 2016 — Ch. 3 "Embracing Risk" (error budgets), Ch. 6 (monitoring).
- N. Forsgren, J. Humble, G. Kim, Accelerate: The Science of Lean Software and DevOps, IT Revolution Press, 2018.
- Monetary Authority of Singapore, Notice on Technology Risk Management — incident notification within 1 hour of discovery.
- FFIEC, Business Continuity Management Handbook, Federal Financial Institutions Examination Council, 2019.
- DRII, Professional Practices for Business Continuity Management, Disaster Recovery Institute International.
- Uptime Institute, Tier Classification Standard for data center infrastructure resilience.


